Plugin Window
UE4 plugin for Grail is shipped along with the editor module. It provides a window that simplifies the user experience with Grail. It can be opened by selecting Window → GrailWindow
-
Debugger
-
Config files explorer
-
Debug files explorer
Independently of those, the user can provide plugin window with a system path to Grail Tool’s executable, which will allow them to open Grail files directly from plugin.
Debugger
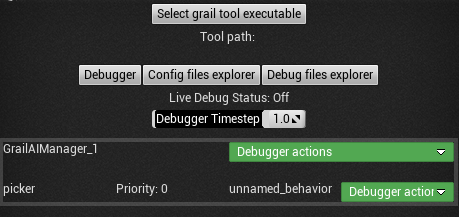
Debugger works only in the PIE mode and allows the user to configure dumping of debug info to files to read more data on the AI state.
After entering play mode, debugging mode can be initialized by clicking the Initialize Debugging button.
The main view lists all available managers and their registered entities along with their priority for that manager and currently executed behavior.
This window allows the user to attach the debugger to certain managers and all or some of entities registered to them. Attaching the debugger to a manager will cause it to start writing debug data to a file (placed in the main project directory) which can later be viewed either in the debug files explorer or more extensively in Grail Tool. Said file will be created whenever the debugger detaches from its observed manager, which means either when the user does that manually or when play mode terminates. To attach the debugger to a manager or entity, click on the green button next to the manager or entity.
Debugger Timestep defines how often (in seconds) debugger will cache debug data.
The user can also activate live debug in the debugger view. To do so, the user needs to click the Debugger Actions menu beside the manager and choose Toggle Live Debug option. If that manager is attached, its debug data will also be sent to Grail Tool’s live session via the local network.
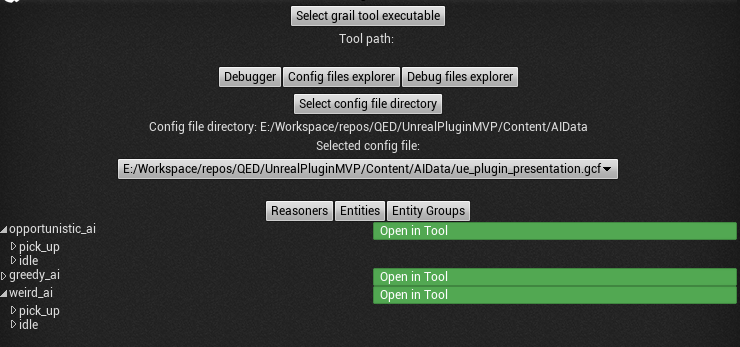
Config Files Explorer
-
Defined
UtilityReasonersalong with behaviors they consist of and their subordinate consideration. -
Entities and their assigned reasoners.
-
Entity groups and entities they contain.
Each of those options can be opened in Grail Tool by clicking on the button beside the desired option.
Debug Files Explorer
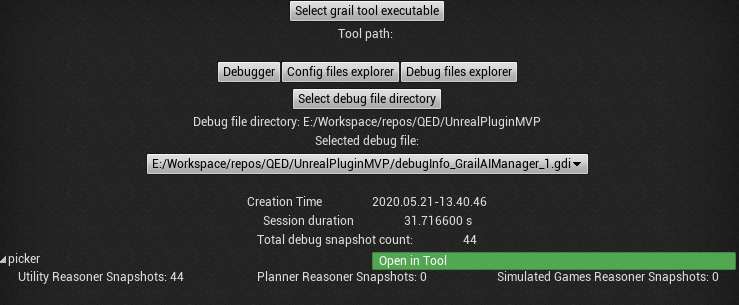
In debug files explorer mode, the user can quickly view details of the selected debug file. There is some general information such as session duration, creation time, and total number of snapshots. Then, there is a list of all entities that produced at least one snapshot during debugging session. Each of those entities also lists the total number of produced snapshots of each type.
Debug files can be opened by clicking on the button beside one of the listed options.