Planner Debugger
Before you start
This manual page is devoted to working with Planner debugger. This assumes you have set up your game to make it provide data snapshots to the tool. There are two ways to do this:
-
With files - the game serializes snapshots with debug data to the disk
-
Live debugging - the game communicates with the tool via network and provides the data directly
For the purpose of the debugger description, we assume the first case, because the source of the debug data does not affect the workflow with the GUI tool.
The data acquisition step applies to all debugging tools. You need to enable debugging of the respective AIEntity that uses PlannerReasoner.
In order to see how to set up your game so it produces snapshots, please refer to Debugging Setup: Tutorial.
Load the data
Once you have the debug file, load it using the dashboard (Overview). These files will typically come with the extension *.gdi (grail debug info).
If the file contains debug information for Planners, then you can view it by switching to the Planner reasoner tab.
Please note, that the file may contain more debug information, e.g. full snapshot with multiple entities and their reasoners.
The provided tool enables you to view what you what to focus on at the moment.
Debugging Planners
Planner debugger has a single-page layout. Figure 1 shows the interface:
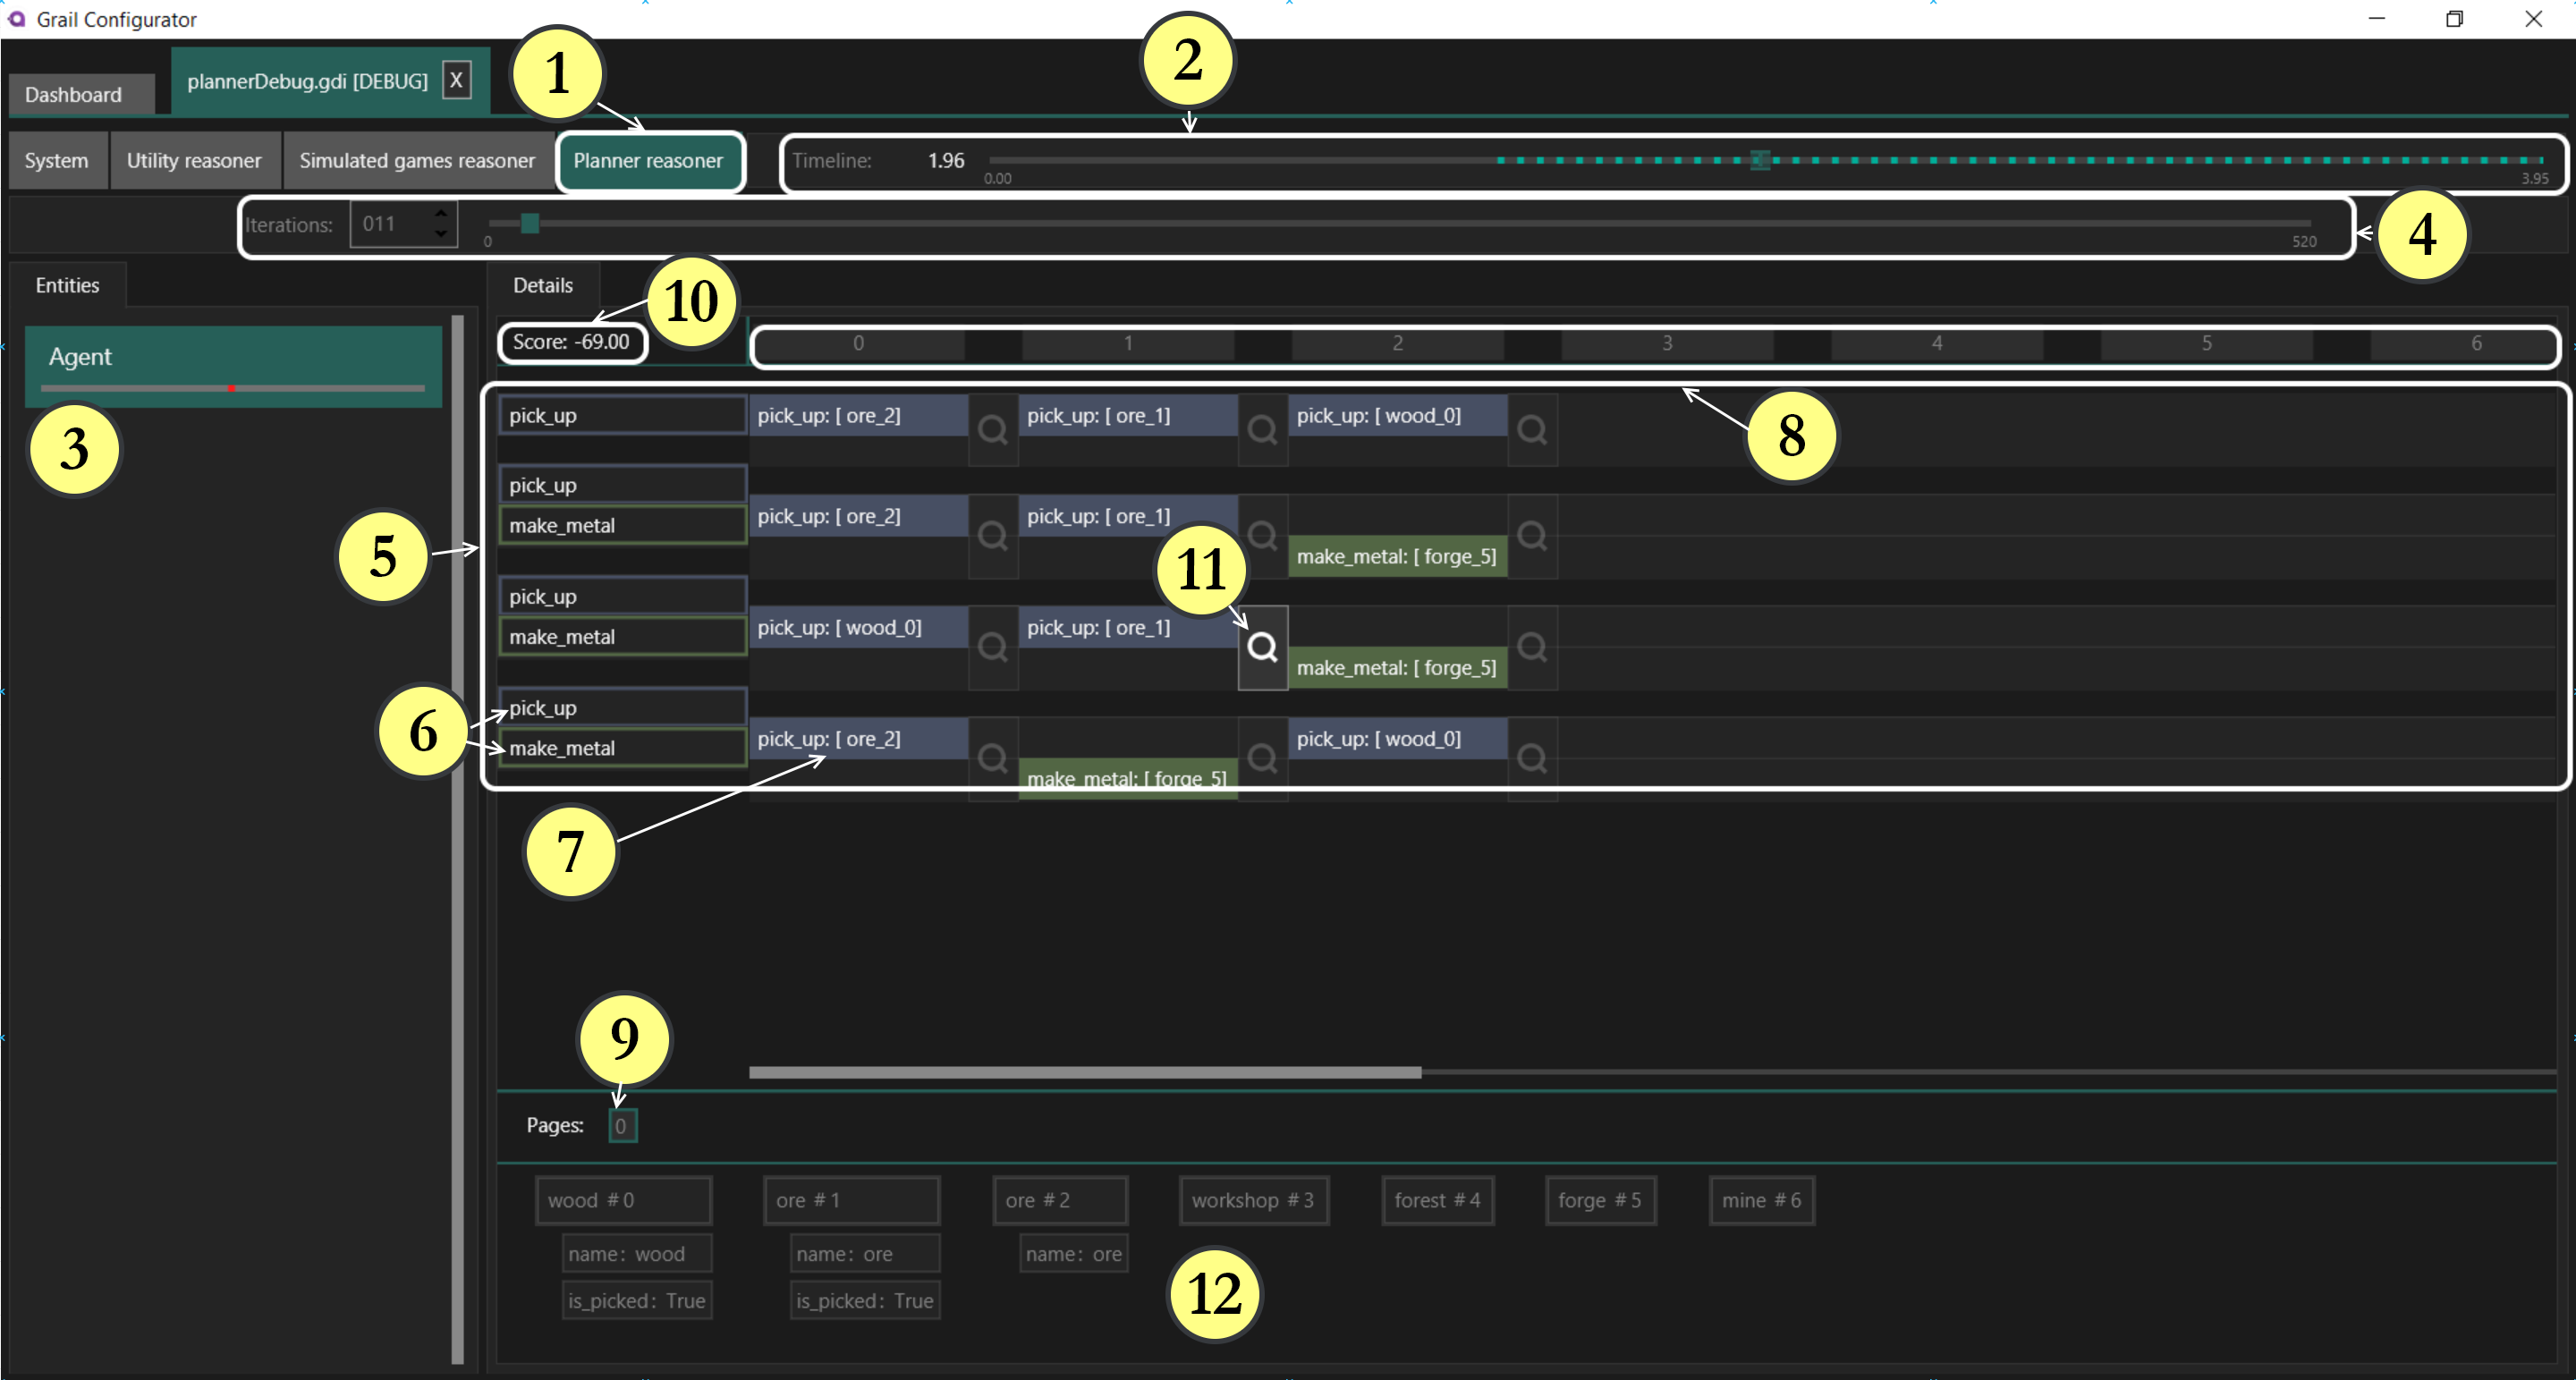
The interface
(2) - Timeline - this is the timeline of events that happened during the game while debugging was on.
By manipulating the timeline you can visualize the changes to AI state over time.
The fragments marked by dots in a lighter color denote timestamps, in which the data is available.
Click them or use the slider to set a particular time.
In Figure 1 shown above, all data was gathered when the game time was equal to 0.30 and the dot is hidden under the slider.
(3) - Entity list - on this list you can see all entities that use Planners as their reasoner and are present in the currently open debug file. This is a common tab for all debug views.
(4) - Iterations - planning is an iterative process. You can select the current iteration to show here. You can either use the numeric box on the left or the slider. You can see the number of iterations available in the current timestamp on the right next to the slider. To find the first iteration, first scroll the timeline to the first data available and then set the iteration number to 0.
(5) - Plans - each bar (consisting of smaller rows) is a plan. The debugger will show a list of plans that form the pareto front of the best plans. So what you see here are the ex aequo best plans for the currently selected iteration and timestamp. Try changing the iteration and see how the best plan(s) evolve(s) in time.
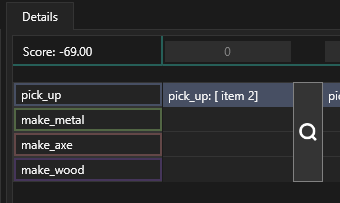
(6) - Action templates - all the action templates defined are display here for each plan in form of a special column. This is for viewing convenience - the actions derived from a particular template will be displayed on the same level (in the same row).
(7) - Actions - the consecutive actions that are part of the plan are displayed here. The actions are positioned in the same row as templates they were instantiated from.
(8) - Steps - ordering of actions in a plan. There are as many steps as there are actions in the longest plan shown.
(9) - Page - pagination if there are so many best plans, that loading them at once would be slow. Just a GUI optimization.
(10) - Score - here you can check the plan heuristic score (if a heuristic was provided) or an information that a plan reaching the goal was already found. This is a very important information, because it allows to analyze whether the score increases with iterations. Since the viewer shows the front of the best plans, then, each of them has the same score by definition.
(11) - World state selector - click this magnifying glass icon to view state of the world that occured after the action that is adjacent to the left.
(12) - World state view - here you can view state of all the WorldObjects that make up for the current state of the world.
This lets you analyze the effects of actions and basically whether the planning domain was defined as intended.
You may choose how WorldObjects are serialized.
In order to learn more about this, read the Debugging Setup: Tutorial.
Typical Usage
This section is to give you an idea what the Simulated Game debugger GUI tool is useful for.
The expected usage is to:
-
Check if the logic is correct - by clicking the magnifying glasses ((10) in Figure 1) you can inspect whether the world state changes as expected after actions are applied.
-
Observe how the plans the planner finds in various iterations look like - take some time to see what actions are performed and in what order.
-
Check if the planner converges and how fast. You best situation is when the score increases with more iterations and the front of the best plans is relatively small.
-
Evaluate the quality of your heuristic. If the front of the best plans is large and there is no convergence it is probably the right time to try with a different heuristic.
-
You will probably be using the debugger if planner does not find the goal in reasonable amount of time. Using the tool you can see if the plans in various simulations differ from each other. If they do significantly, even in iterations close to each other, then maybe the process is too random. This effect can also be caused by unsuitable heuristic.