Simulated Game Debugger
Before you start
This manual page is devoted to working with Simulated Game debugger. This assumes you have set up your game to make it provide debug data snapshots to the tool. There are two ways to do this:
-
With files - the game serializes snapshots with debug data to the disk
-
Live debugging - the game communicates with the tool via network and provides the data directly
For the purpose of the debugger description, we assume the first case, because the source of data does not affect the workflow of the GUI tool.
The data acquisition step applies to all debugging tools. You need to enable debugging of the respective AIEntity that uses SimulatedGameReasoner.
In order to see how to set up your game so it produces snapshots, please refer to Debugging Setup: Tutorial.
Load data
Once you have a debug file, load it using the dashboard (Overview). These files will typically come with *.gdi extension (grail debug info).
If the file contains debug information for Simulated Games, then you can view it by switching to the Simulated game reasoner tab ((1) - in Figure 1).
Please note that the file may contain more debug information, e.g. full game snapshot with multiple entities and their reasoners.
The provided tool enables you to view what you what to focus on at the moment.
Debugging Simulated Games
Simulated Games debugger has a single-page layout. Figure 1 shows the interface:
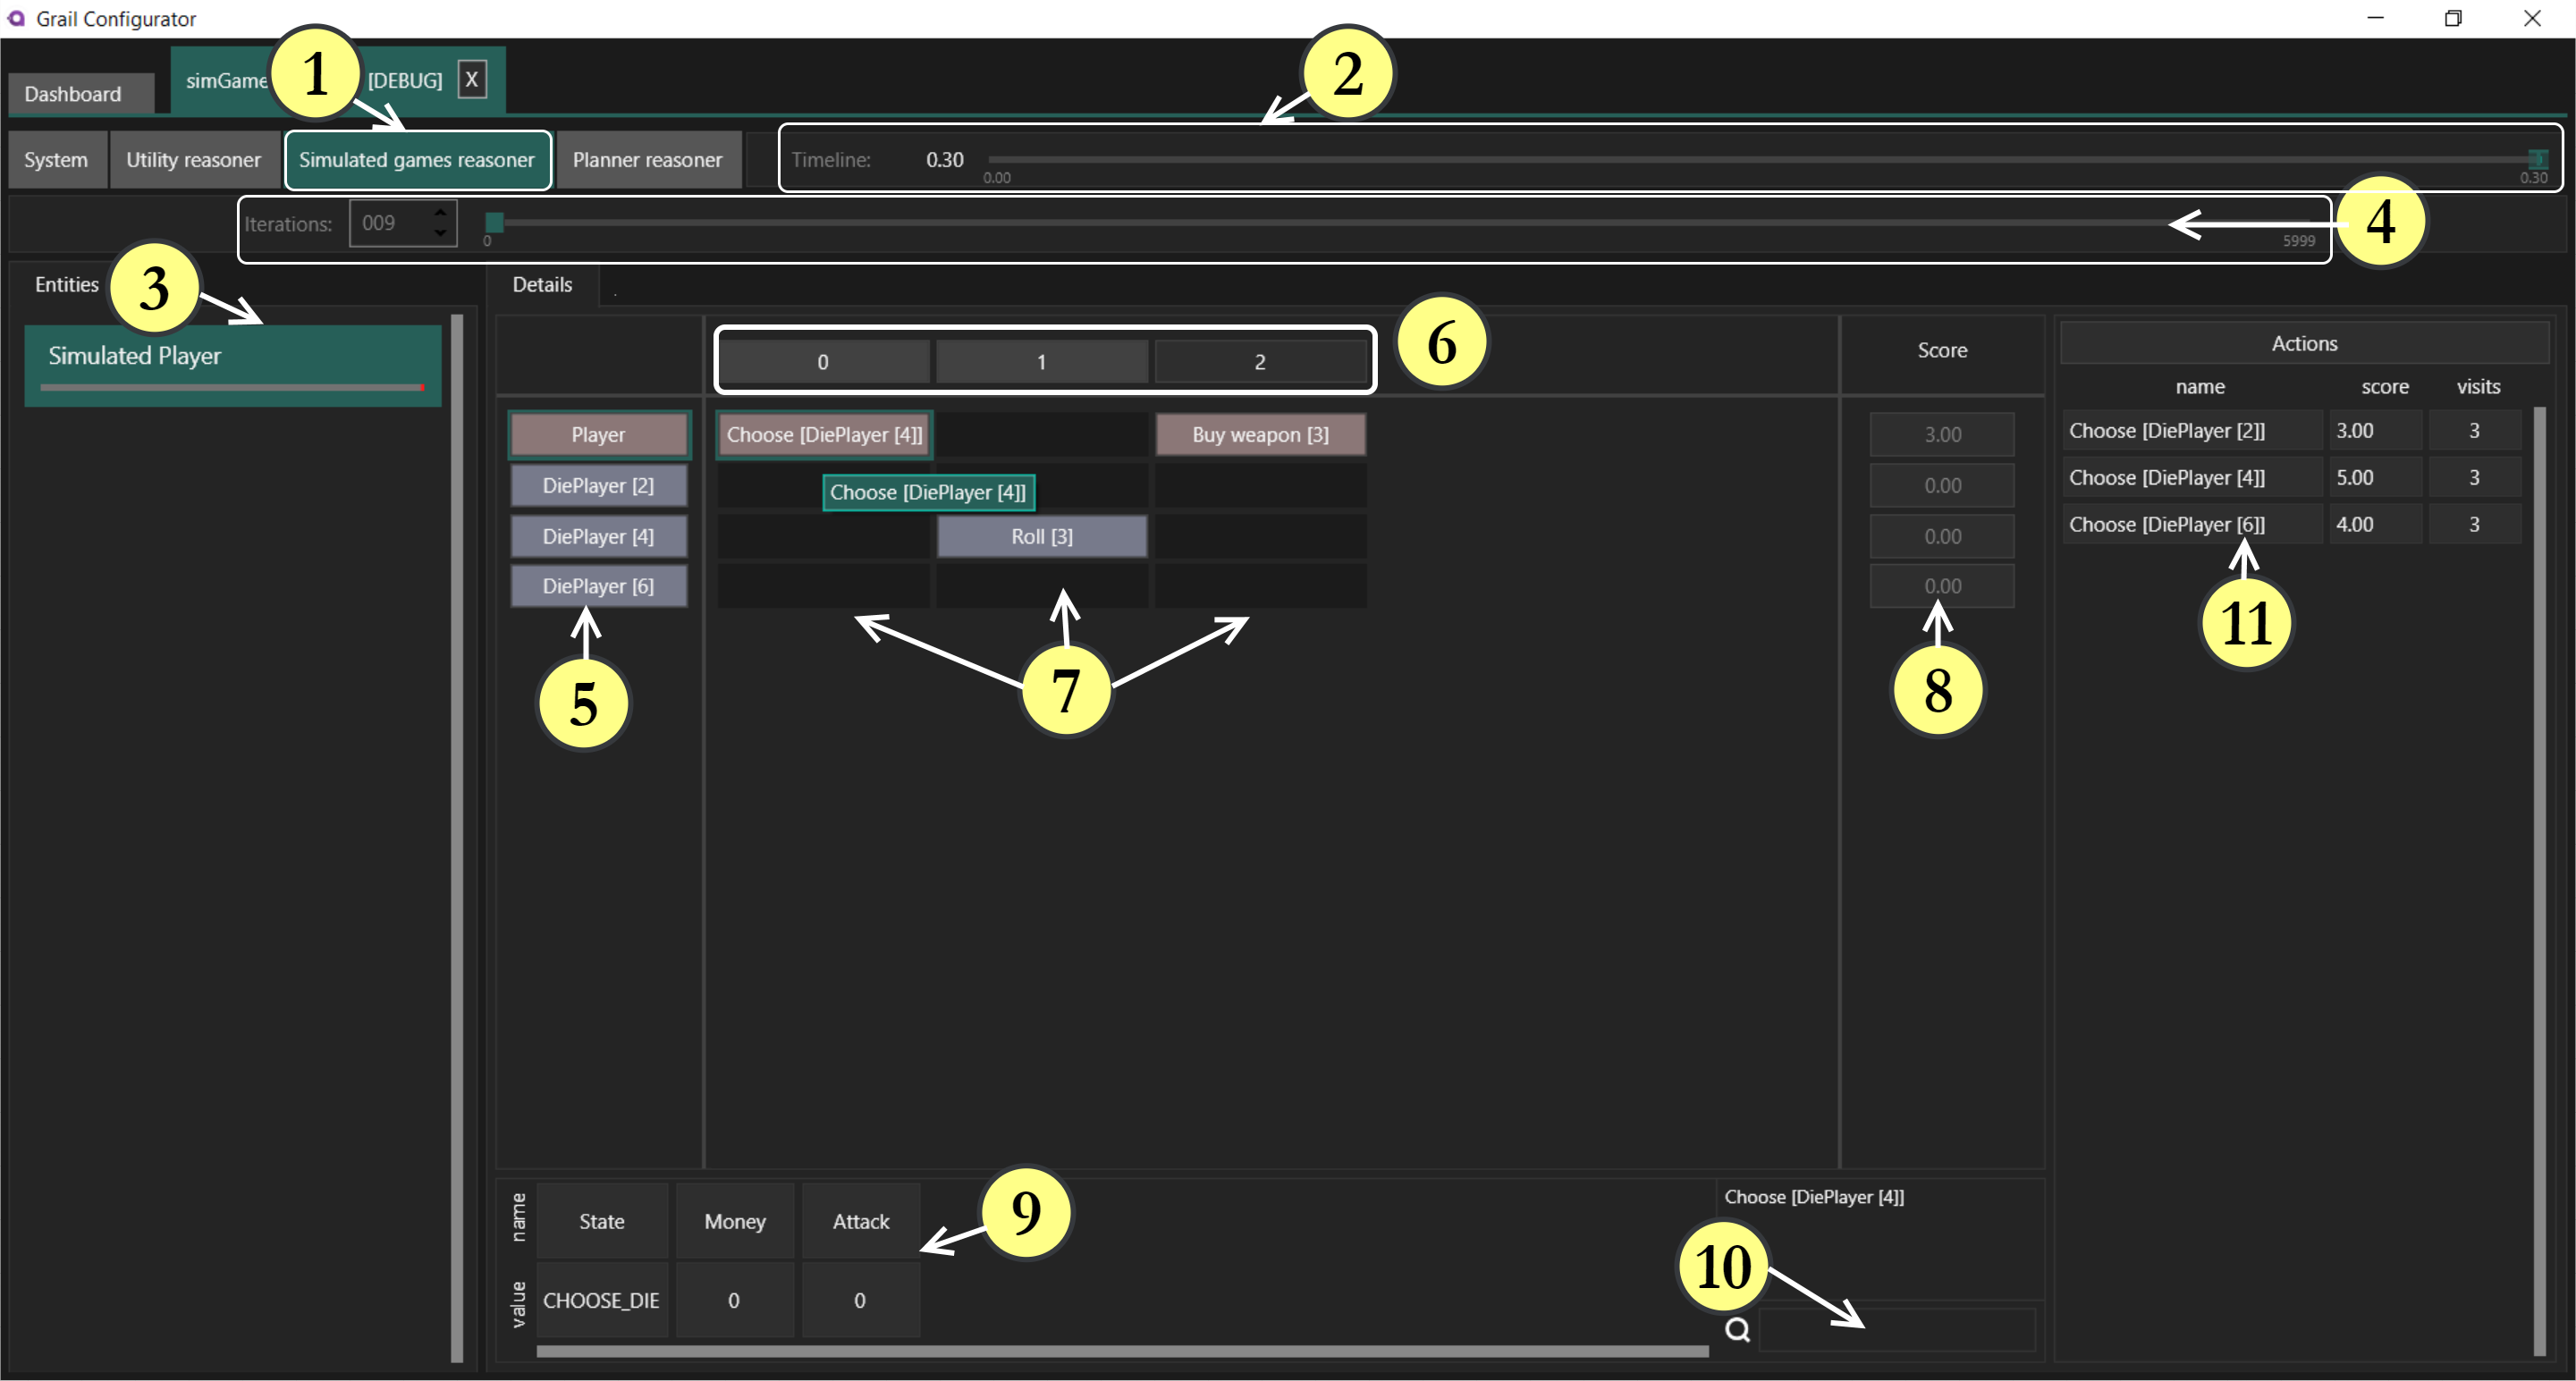
The interface
(2) - Timeline - this is the timeline of events that happened during the game while debugging was on.
By manipulating the timeline you can visualize changes to AI state over time.
The fragments marked by dots in a lighter color denote timestamps, in which the data is available.
Click them or use the slider to set a particular time.
In Figure 1 shown above, all data was gathered when the game time was equal to 0.30 and the dot is hidden under the slider.
Figure 2 below shows a timeline with 3 timestamps where data is available:

(3) - Entity list - on this list you can see all entities that use Simulated Games as their reasoner and are present in the currently open debug file. This is a common tab for all debug views.
(4) - Iterations - here you can set the iteration (simulation) to view from the snapshot. You can either use the numeric box on the left or the slider. You can see the number of simulations available in the current timestamp on the right next to the slider. To find the first iteration, first scroll the timeline to the first data available and then set the iteration number to 0.
(5) - Units - here, units are listed in a column sorted by teams (the TeamIndex property).
Units of the same team share the same color.
A unit is shown in the debugger if it performed at least one action in any iteration or was explicitly added by the game.AddUnit(…) function.
(6) - Steps - the numbers denote consecutive steps in the selected iteration.
A step corresponds to exactly one action performed by the active unit.
Please note that some number of initial steps may be highlighted.
This means that actions in these steps were performed in the selection phase of the simulation algorithm.
The remaining actions were performed in the simulation phase also known as the Monte Carlo phase.
If you are not familiar with the two phases of the Simulated Game algorithm - Monte Carlo Tree Search - you may wish to read our introduction to Simulated Games first.
Actions taken in the selection step contain more metadata than actions in the simulation phase.
If you click on them, you have access to the Actions considered window on the right-hand side denoted by (11) in Figure 1.
If you click on actions taken in the simulation phase, this window will be empty.
[7] Actions taken - this grid shows all actions that were performed in the iteration.
The row corresponds to the unit that made the action and the column corresponds to the step.
If the name of the action is too long to fit the box, hover the mouse over it.
You can click the action to see the state of the game as serialized after applying this action and - if the action was chosen in the selection step - the statistics of other actions available at the same time.
[8] Scores - here you can check the scores achieved by each unit in the currently selected iteration. Units of the same team share the same score.
[9] State - click any action on a grid that was performed in the selection phase - so the step (column header) is highlighted.
Select a unit to the left or have one already selected.
In the bottom panel denoted by (9), you can see the state of the unit that occured after the action was applied.
The action does not need to be of the same unit, because any action may affect states of any units.
The state is shown in the form of a dictionary with property names and values. Only properties chosen for serialization will be shown here.
In Figure 1, the Player unit and Choose [DiePlayer [4]] action were selected, so you can see the state of the Player unit after this action.
[10] Filter states - enter a text here to show only such properties of the state that contain the entered text (as substring) in their name (key).
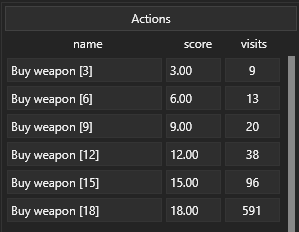
[11] Actions considered - this window is populated if you click an action performed in the selection phase.
You can observe all actions that were available to the currently active unit.
The score column denotes the assessment of the action by the Monte Carlo Tree Search.
One of the steps of defining a Simulated Game is to provide scores for each team when the game is finished.
This is the expected score to be later achievied by the unit, if it takes this action.
Therefore, this is also the expected score of the unit’s team.
The higher the number, the better for the unit and its team.
The visits column denotes how many times the action was chosen in simulations.
The higher the number, the assessment of the action is more confident ⇒ more likely statistically significant.
Typical Usage
This section is to give you an idea what the Simulated Game debugger GUI tool is useful for.
The expected usage is to:
-
Verify if the Simulated Game logic is correctly implemented. You can observe how the state changes (9) after applying actions and what actions were available in a particular state (11).
-
Observe scores - you can see which sequences of actions lead to particular score. Are the scores correct evaluation of the terminal state?
-
Observe scores distribution among actions (11). Maybe the scores are too similar to each other and therefore the algorithm explores the action space evenly withouht giving more credit to better actions. You can observe this if the visits count (panel (11)) are similar to each other. If they are, you might increase the exploration ratio provided in the
SimulatedGameconstructor. -
Observe convergence or not - in a typical scenario, the simulations should converge. The convergence is happening if the consecutive iterations look similar to each other (contain many of the same actions) and there are actions with very high number of visits. Try increasing the selected iteration as well as going further along timeline and see what changes.
In the example shown in Figure 1, we can see that:
-
the logic is OK - first the Player chooses a die, which happens to be a 4-sided one (DiePlayer [4])
-
next, the die is rolled and the result is 3. This becomes the player’s money in this game.
-
next, the player buys weapon with the available money
-
the weapon does 3 damage which results in score equal to 3.
-
we are looking at iteration 9. The
Simulated Gamehas had not enough time to converge yet. The 4-sided die appears to be better at this moment, because of the randomness involved. It is worth checking now, how this changes in later iterations:
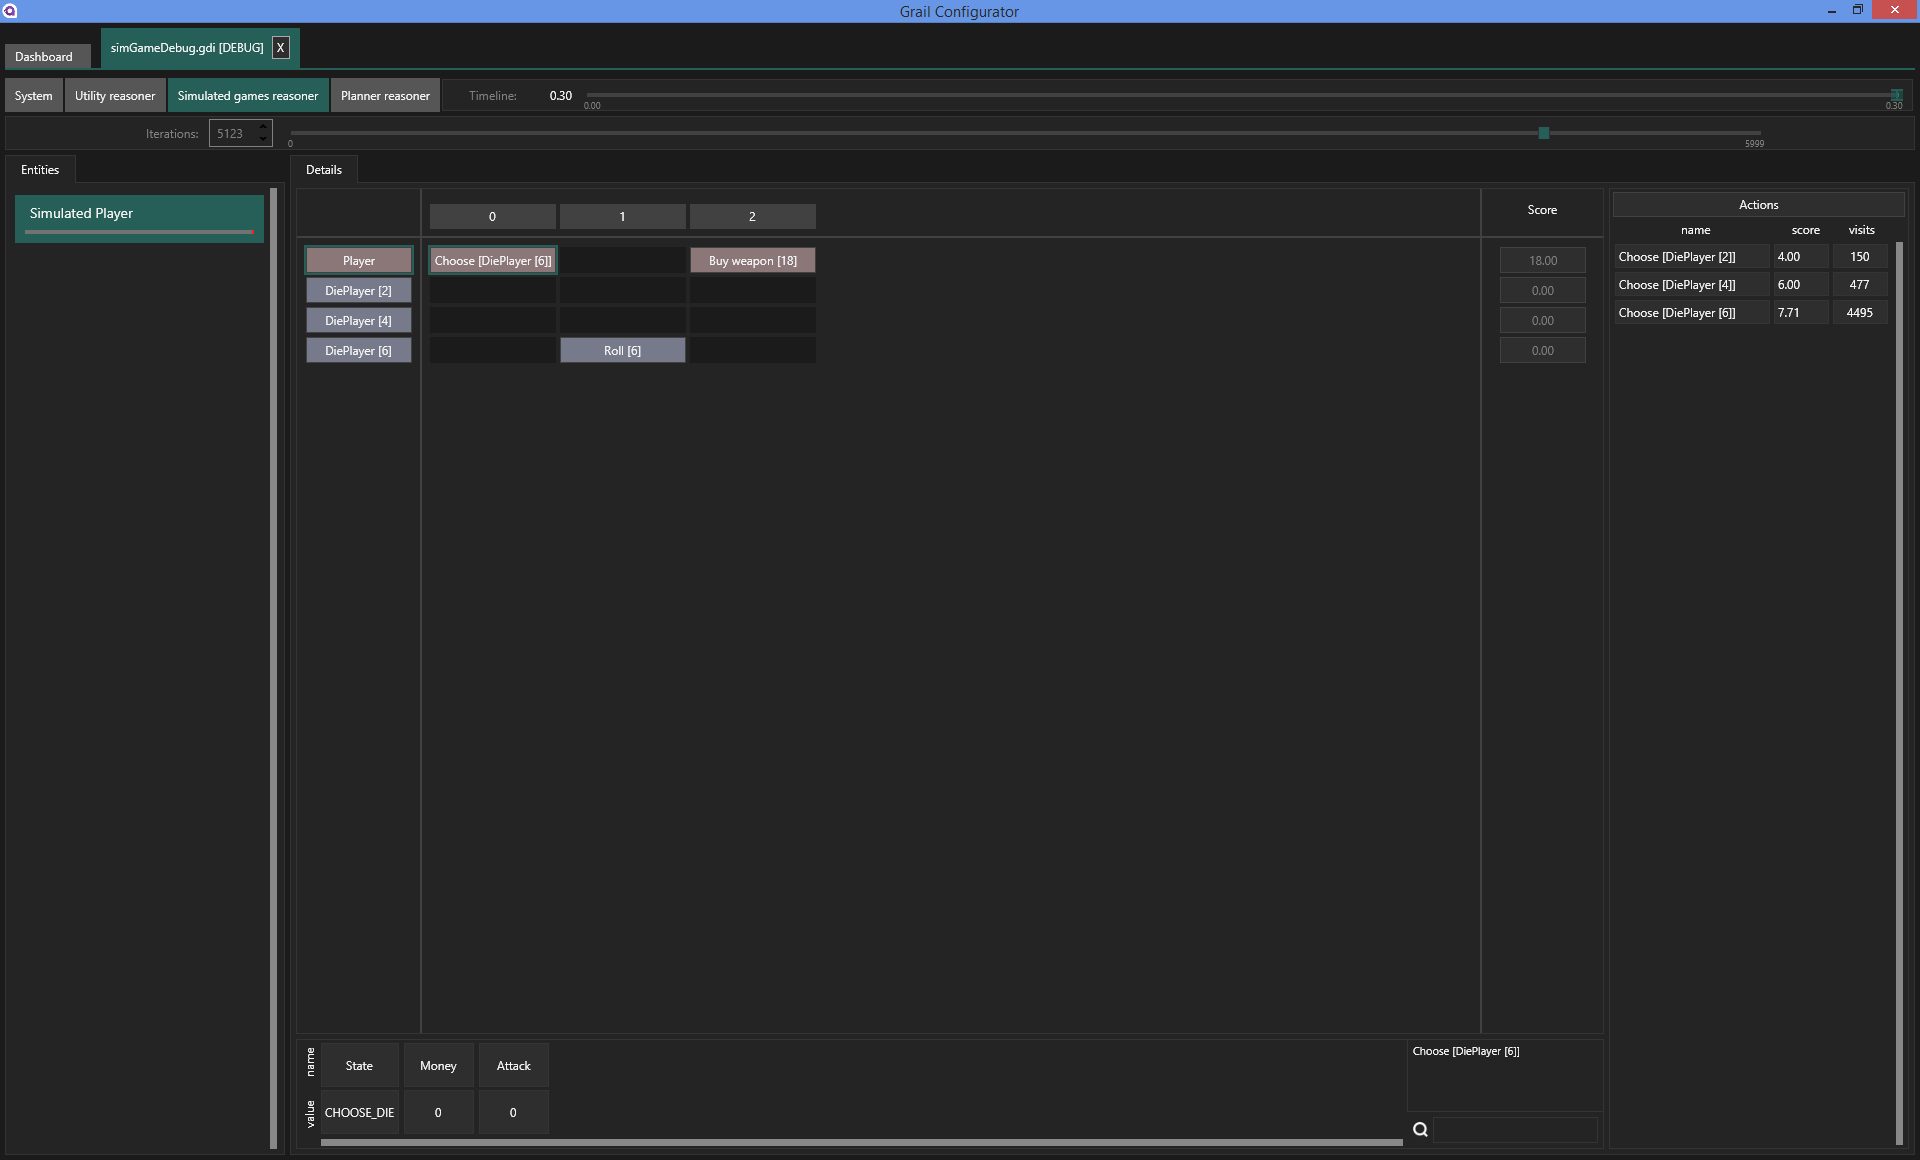
| Please keep in mind, that iterations are aimed at checking possible variants of how the game may be played. During them, the units will not always choose optimal actions. This is a trade-off between exploration and exploitation as explained in the theory if Simulated Games. However, when the simulations are over, the algorithm will recommend the action with the highest expected score. Those actions will be translated to behaviors. |