Entity State Debugger
Before you start
This manual page is dedicated to working with Entity State Debugger. This assumes you have set up your game to make it provide debug data snapshots to the tool. There are two ways to do this:
-
With files - the game serializes snapshots with debug data to the disk
-
Live debugging - the game communicates with the tool via network and provides the data directly
For the purpose of the debugger description, we assume the first case, because the source of data does not affect the workflow of the GUI tool.
In order to see how to set up your game so it produces snapshots, please refer to Debugging Setup: Tutorial.
Load data
Once you have a debug file, load it using the dashboard (Overview). These files will typically come with *.gdi extension (grail debug info).
If the file contains entity debug information, then you can view it by switching to the System tab.
Please note that the file may also contain reasoner debug data.
Debugging Entity States
Entity State Debugger has a single-page layout.
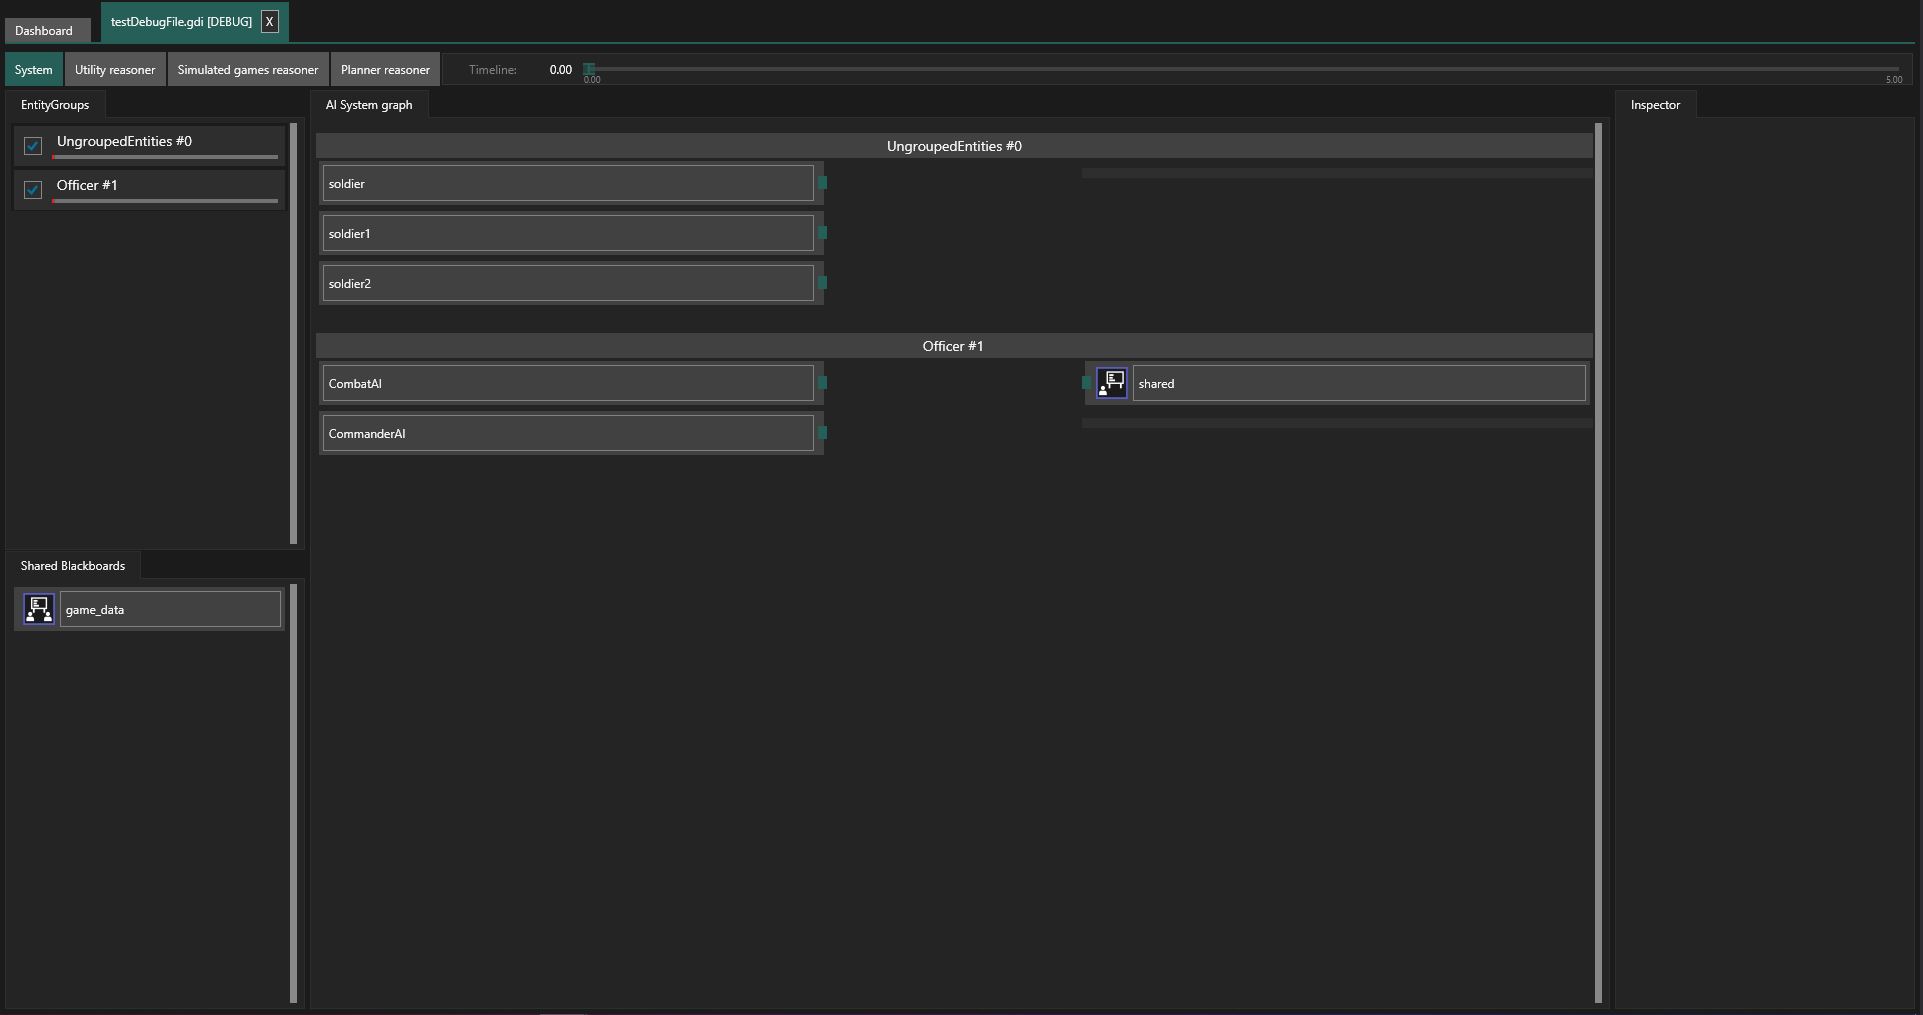
In addition to the timeline slider common to all debugger views, the window consists of the following panels:
-
Entity Group list
A list of all entities that produced debug data during the debugging session. Entities that haven’t been assigned to any group, are placed inside an artificial group called 'UngroupedEntities'. Each entity group has a checkbox that you can check if you want to see the group’s details.
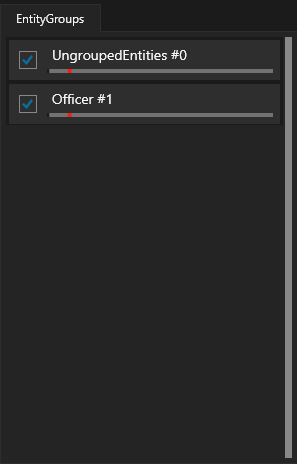 Figure 3. Entity Group Selection List
 -
Global shared Blackboard list
A list of all global shared Blackboards from the debugging session.
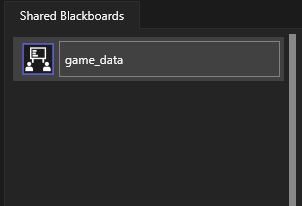 Figure 4. Shared Blackboard List
 -
Entity Group details view
This view shows details of selected Entity Groups, namely entities (on the left) and blackboards (on the right) belonging to the groups. Each of these items can be selected and viewed in the inspector.
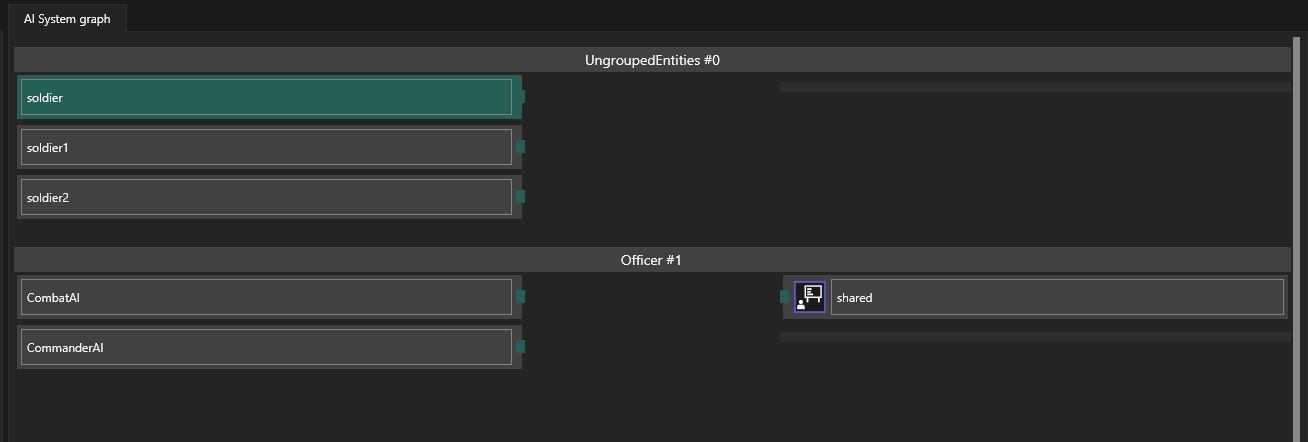 Figure 5. Entity Group List View
 -
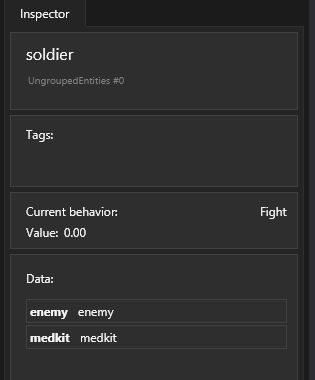
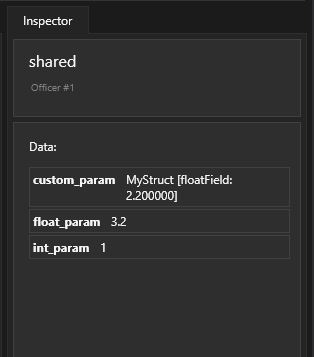
Entity and shared Blackboard inspector
Here you can view details of currently selected items
Inspector view
The inspector view comes in two versions, depending on the type of the currently selected item.