Live Debugging
Before you start
This manual page is dedicated to setting up and working with the tool’s Live Debugging tools. This assumes you have set up your game to make it provide debug data snapshots to the tool.
In order to see how to set up your game so it produces snapshots, please refer to Debugging Setup: Tutorial.
Connecting to live debugger server
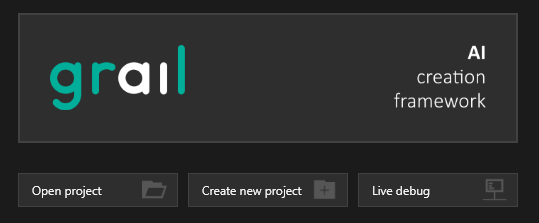
To connect to Grail’s debug data server running in your game, click on the Live debug button to the right.
You’ll be presented with a simple dashboard, allowing you to search your local network for server instances.
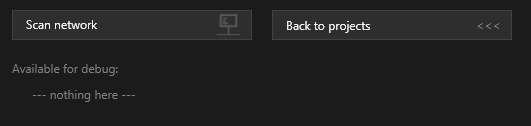
After clicking the Scan network button, the tool will search the local network and list all instances of Grail’s debug data servers that you can attach to.
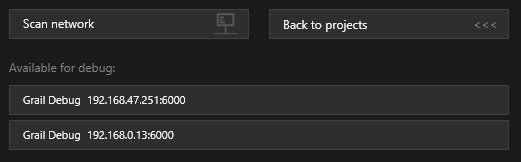
After choosing one of the listed servers, a debugging view will open. From the user interface standpoint, live debugging is very similar to offline debugging using saved .gdi files.
The only difference is an additional status view that you can display by clicking on the Online tab, located in the top left corner.

Live debugging status view
The view consists of two sections: Status and Log Console.
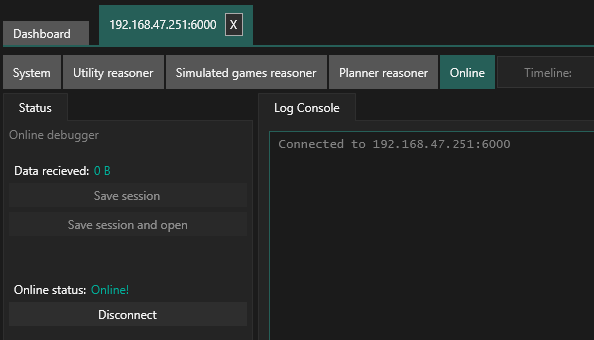
Status section
In the status section, you can see the amount of debug data received so far, as well as the connection status.
Any time during live debugging, you can click the Save session button to serialize debug data to a file.
If you also wish to open the saved file right away, choose the Save session and open button.
Log Console
The log console displays all network events registered by the tool:
-
Connecting
-
Disconnecting
-
Receving debug snapshots from Grail
Using the radio buttons located at the bottom, you can also display Grail logs generated during the debug session, providing you with a great tool to find any issues with your current AI setup.