Plugin Window
Unity plugin for Grail provides an editor window simplifying the user experience with Grail. It can be opened by clicking on Unity’s menu bar and selecting Grail → PluginWindow
-
Debugger
-
Config files explorer
-
Debug files explorer
Independently of those, the user can enter a system path to Grail Tool executable, which will allow them to open Grail files directly from the plugin.
Debugger
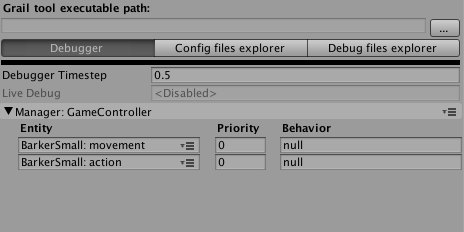
Debugger works in play mode only and allows the user to configure dumping of debug info to files and to display some information on what is currently happening on the screen.
The main view lists all available managers and their registered entities along with their priority for that manager and currently executed behavior.
This window allows user to attach debugger to certain managers and all or some of entities registered to them. Attaching the debugger to a manager will cause it to write debug data to a file (placed in main project directory) which can later be viewed either in the debug files explorer or more extensively in Grail Tool. Said file will be created whenever the debugger detaches from a manager, which means either when the user does that manually or when play mode is terminated. To attach the debugger to a manager or ab entity, click on the menu icon beside the corresponding manager or entity and choose the appropriate option.
Debugger Timestep defines how often (in seconds) debugger will cache debug data.
The user can also activate live debug in the debugger view. To do so, the user needs to click the menu icon beside the manager and choose Live Debug option. If that manager is attached, its debug data will also be sent to Grail Tool’s live session.
Config Files Explorer
-
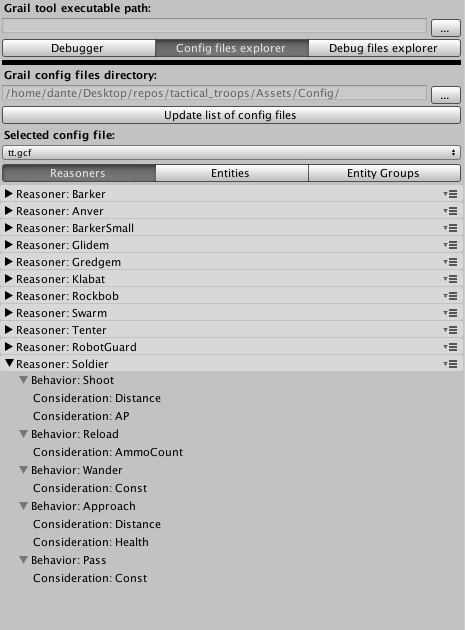
Defined
UtilityReasonersalong with behaviors they consist of and their subordinate consideration. -
Entities and their assigned reasoners.
-
Entity groups and entities they contain.
Each of those options can be opened in Grail Tool by clicking on the menu icon beside the desired option.
Debug Files Explorer
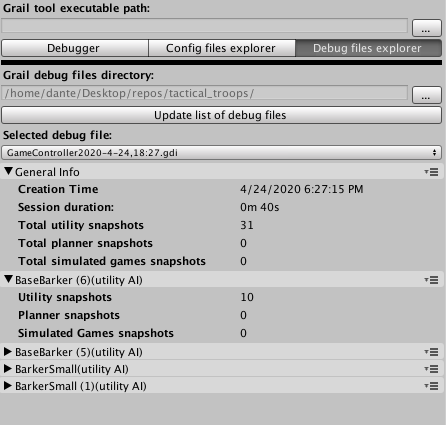
In debug files explorer mode, the user can quickly view details of the selected debug file. There is some general information such as session duration, creation time, and total number of snapshots. Then, there is a list of all entities that produced at least one snapshot during debugging session. Each of those entities also lists the total number of produced snapshots of each type.
Debug files can be opened by clicking on the menu icon beside one of the listed options.