GUI Tools Overview
In this section of documentation we describe the Configuration and Debugging tool shipped with Grail. It allows you to create AI system configurations and to define Utility AI presets using an intuitive graphical interface. Another capability of the tool is a complete AI system debugging suite in which you can analyze changes in the AI state over time.
With this tool, we aim to significantly decrease the time needed for AI debugging and free you up to do more interesting stuff like adding new functionalities to your agents.
Launching the cross-platform tool version
If you’re using the cross-platform version of the tool, you need .Net Core framework runtime installed on your computer(minimum version: 2.1) to launch it.
You can download it from Microsoft’s web page.
Then you can launch the tool by typing running dotnet GrailConfigurator.dll in the command line.
Dashboard
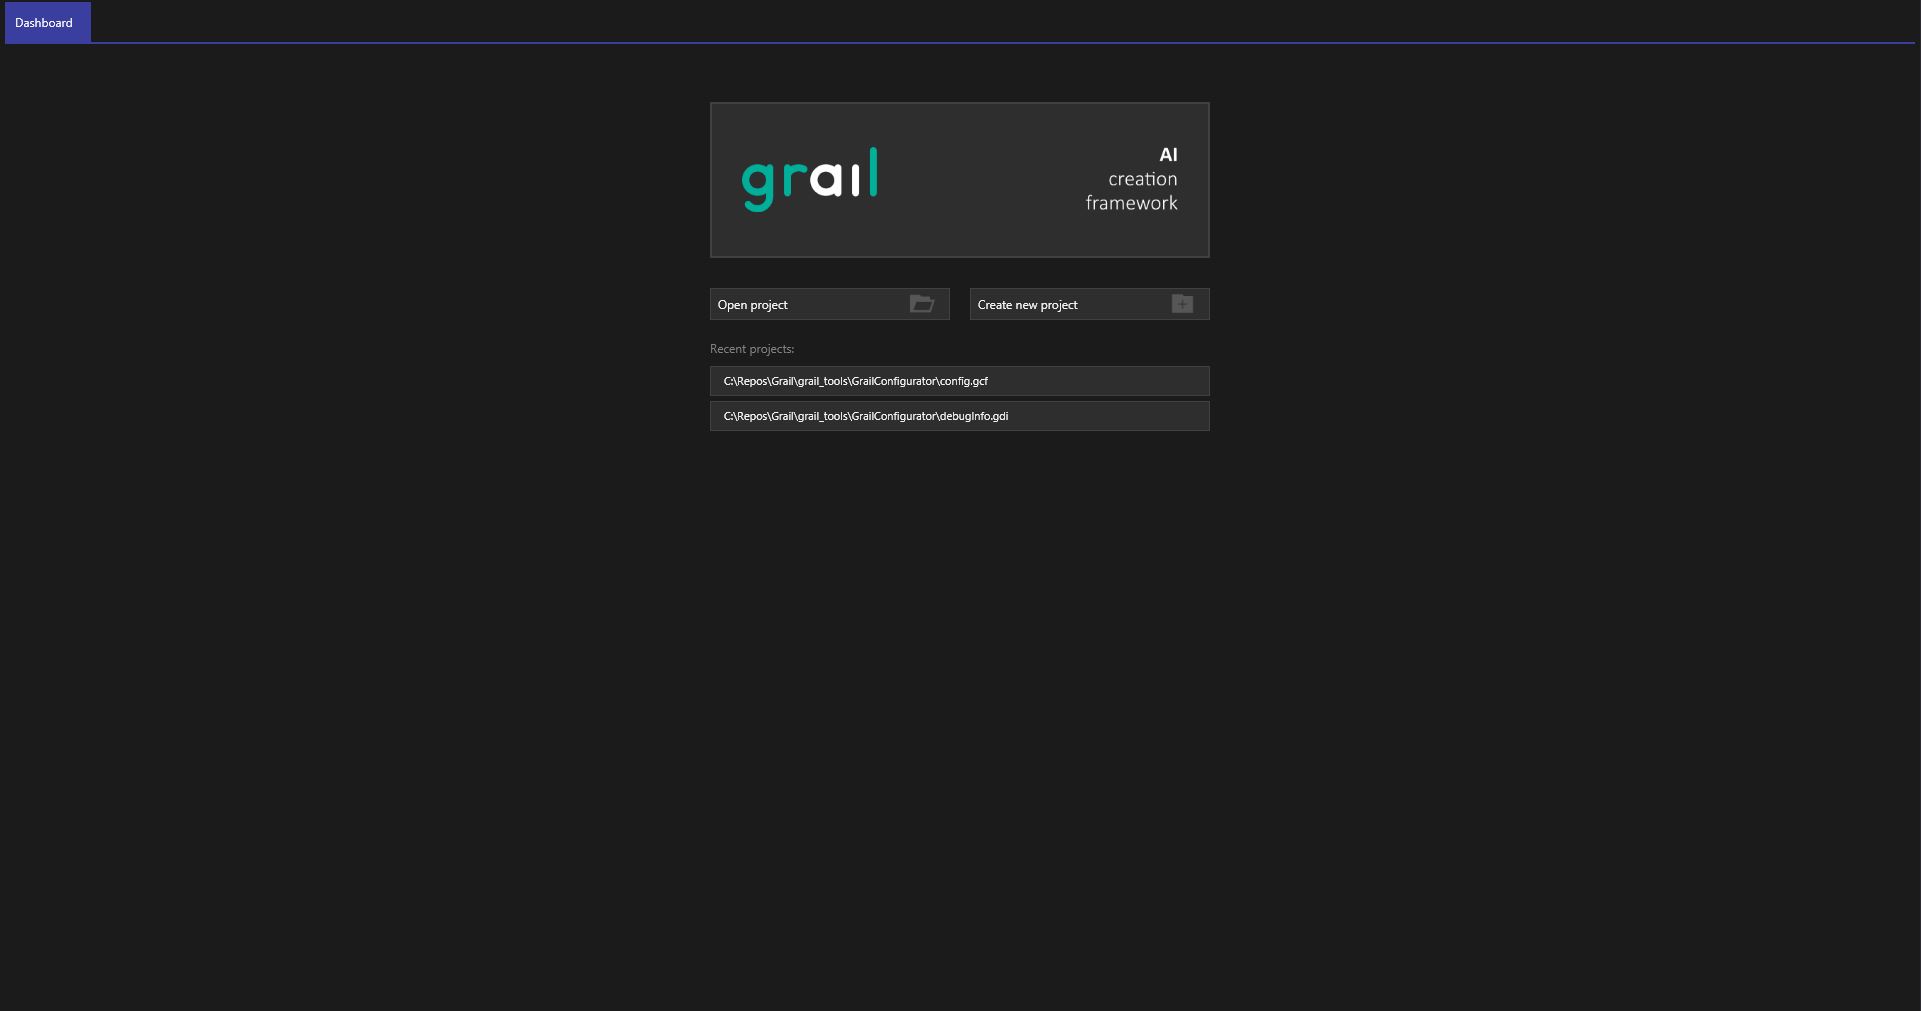
Dashboard is the first view you will see after launching Grail GUI Tools. Here you can choose files that you want to work on.
Open project
This option allows you to open an existing configuration (.gcf) or debug (.gdi) file. If you open a configuration file, the ai system creation tools will open. If you choose a debug file, you will proceed to debugging tools.
Live debug
This option allows you to use the tool’s live debugging feature.