Utility Debugger
Before you start
This manual page is devoted to working with Utility debugger. This assumes you have set up your game to make it provide data snapshots to the tool. There are two ways to do this:
-
With files - the game serializes snapshots with debug data to the disk
-
Live debugging - the game communicates with the tool via network and provides the data directly
For the purpose of the debugger description, we assume the first case, because the source of the debug data does not affect the workflow with the GUI tool.
The data acquisition step applies to all debugging tools. You need to enable debugging of the respective AIEntity that uses UtilityReasoner.
In order to see how to set up your game so it produces snapshots, please refer to Debugging Setup: Tutorial.
Load the data
Once you have the debug file, load it using the dashboard (Overview). These files will typically come with the extension *.gdi (grail debug info).
If the file contains debug information for Utility AI, then you can view it by switching to the Utility reasoner tab.
Please note, that the file may contain more debug information, e.g. full snapshot with multiple entities and their reasoners.
The provided tool enables you to view what you what to focus on at the moment.
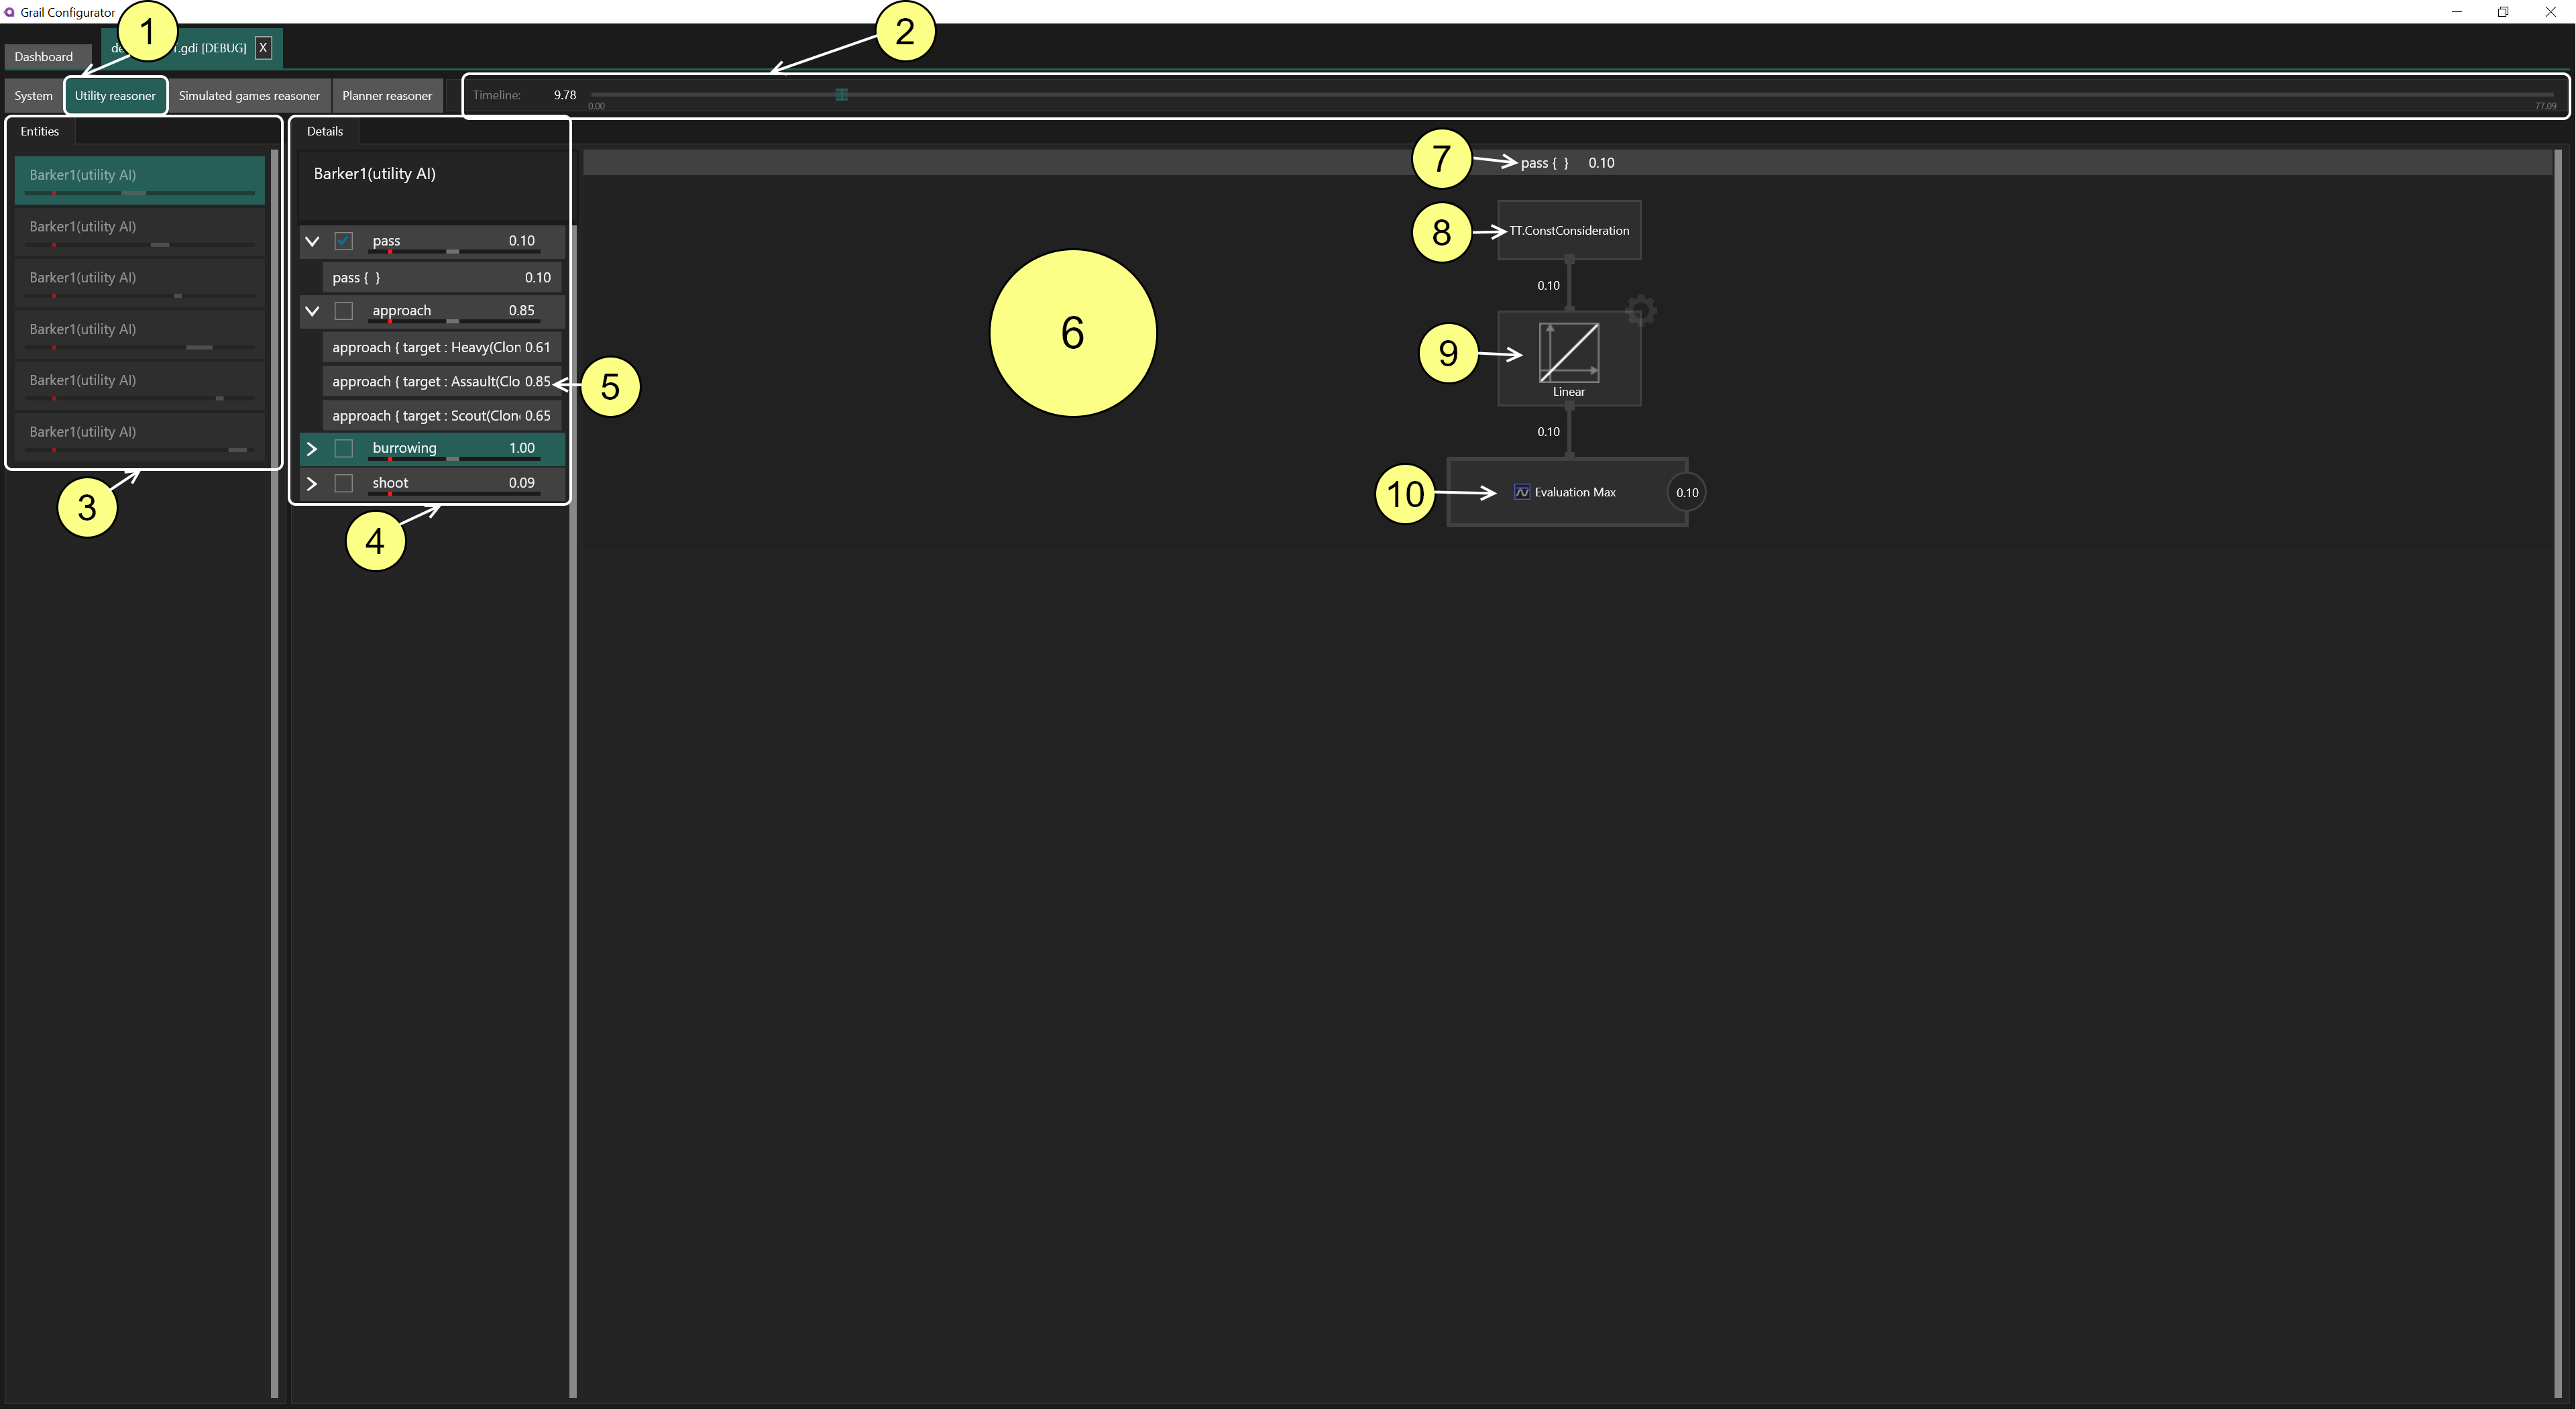
The interface
(2) - Timeline - this is the timeline of events that happened during the game while debugging was on.
By manipulating the timeline you can visualize the changes to AI state over time.
The fragments marked by dots in a lighter color denote timestamps, in which the data is available.
Click them or use the slider to set a particular time.
In Figure 1 shown above, all data was gathered when the game time was equal to 0.30 and the dot is hidden under the slider.
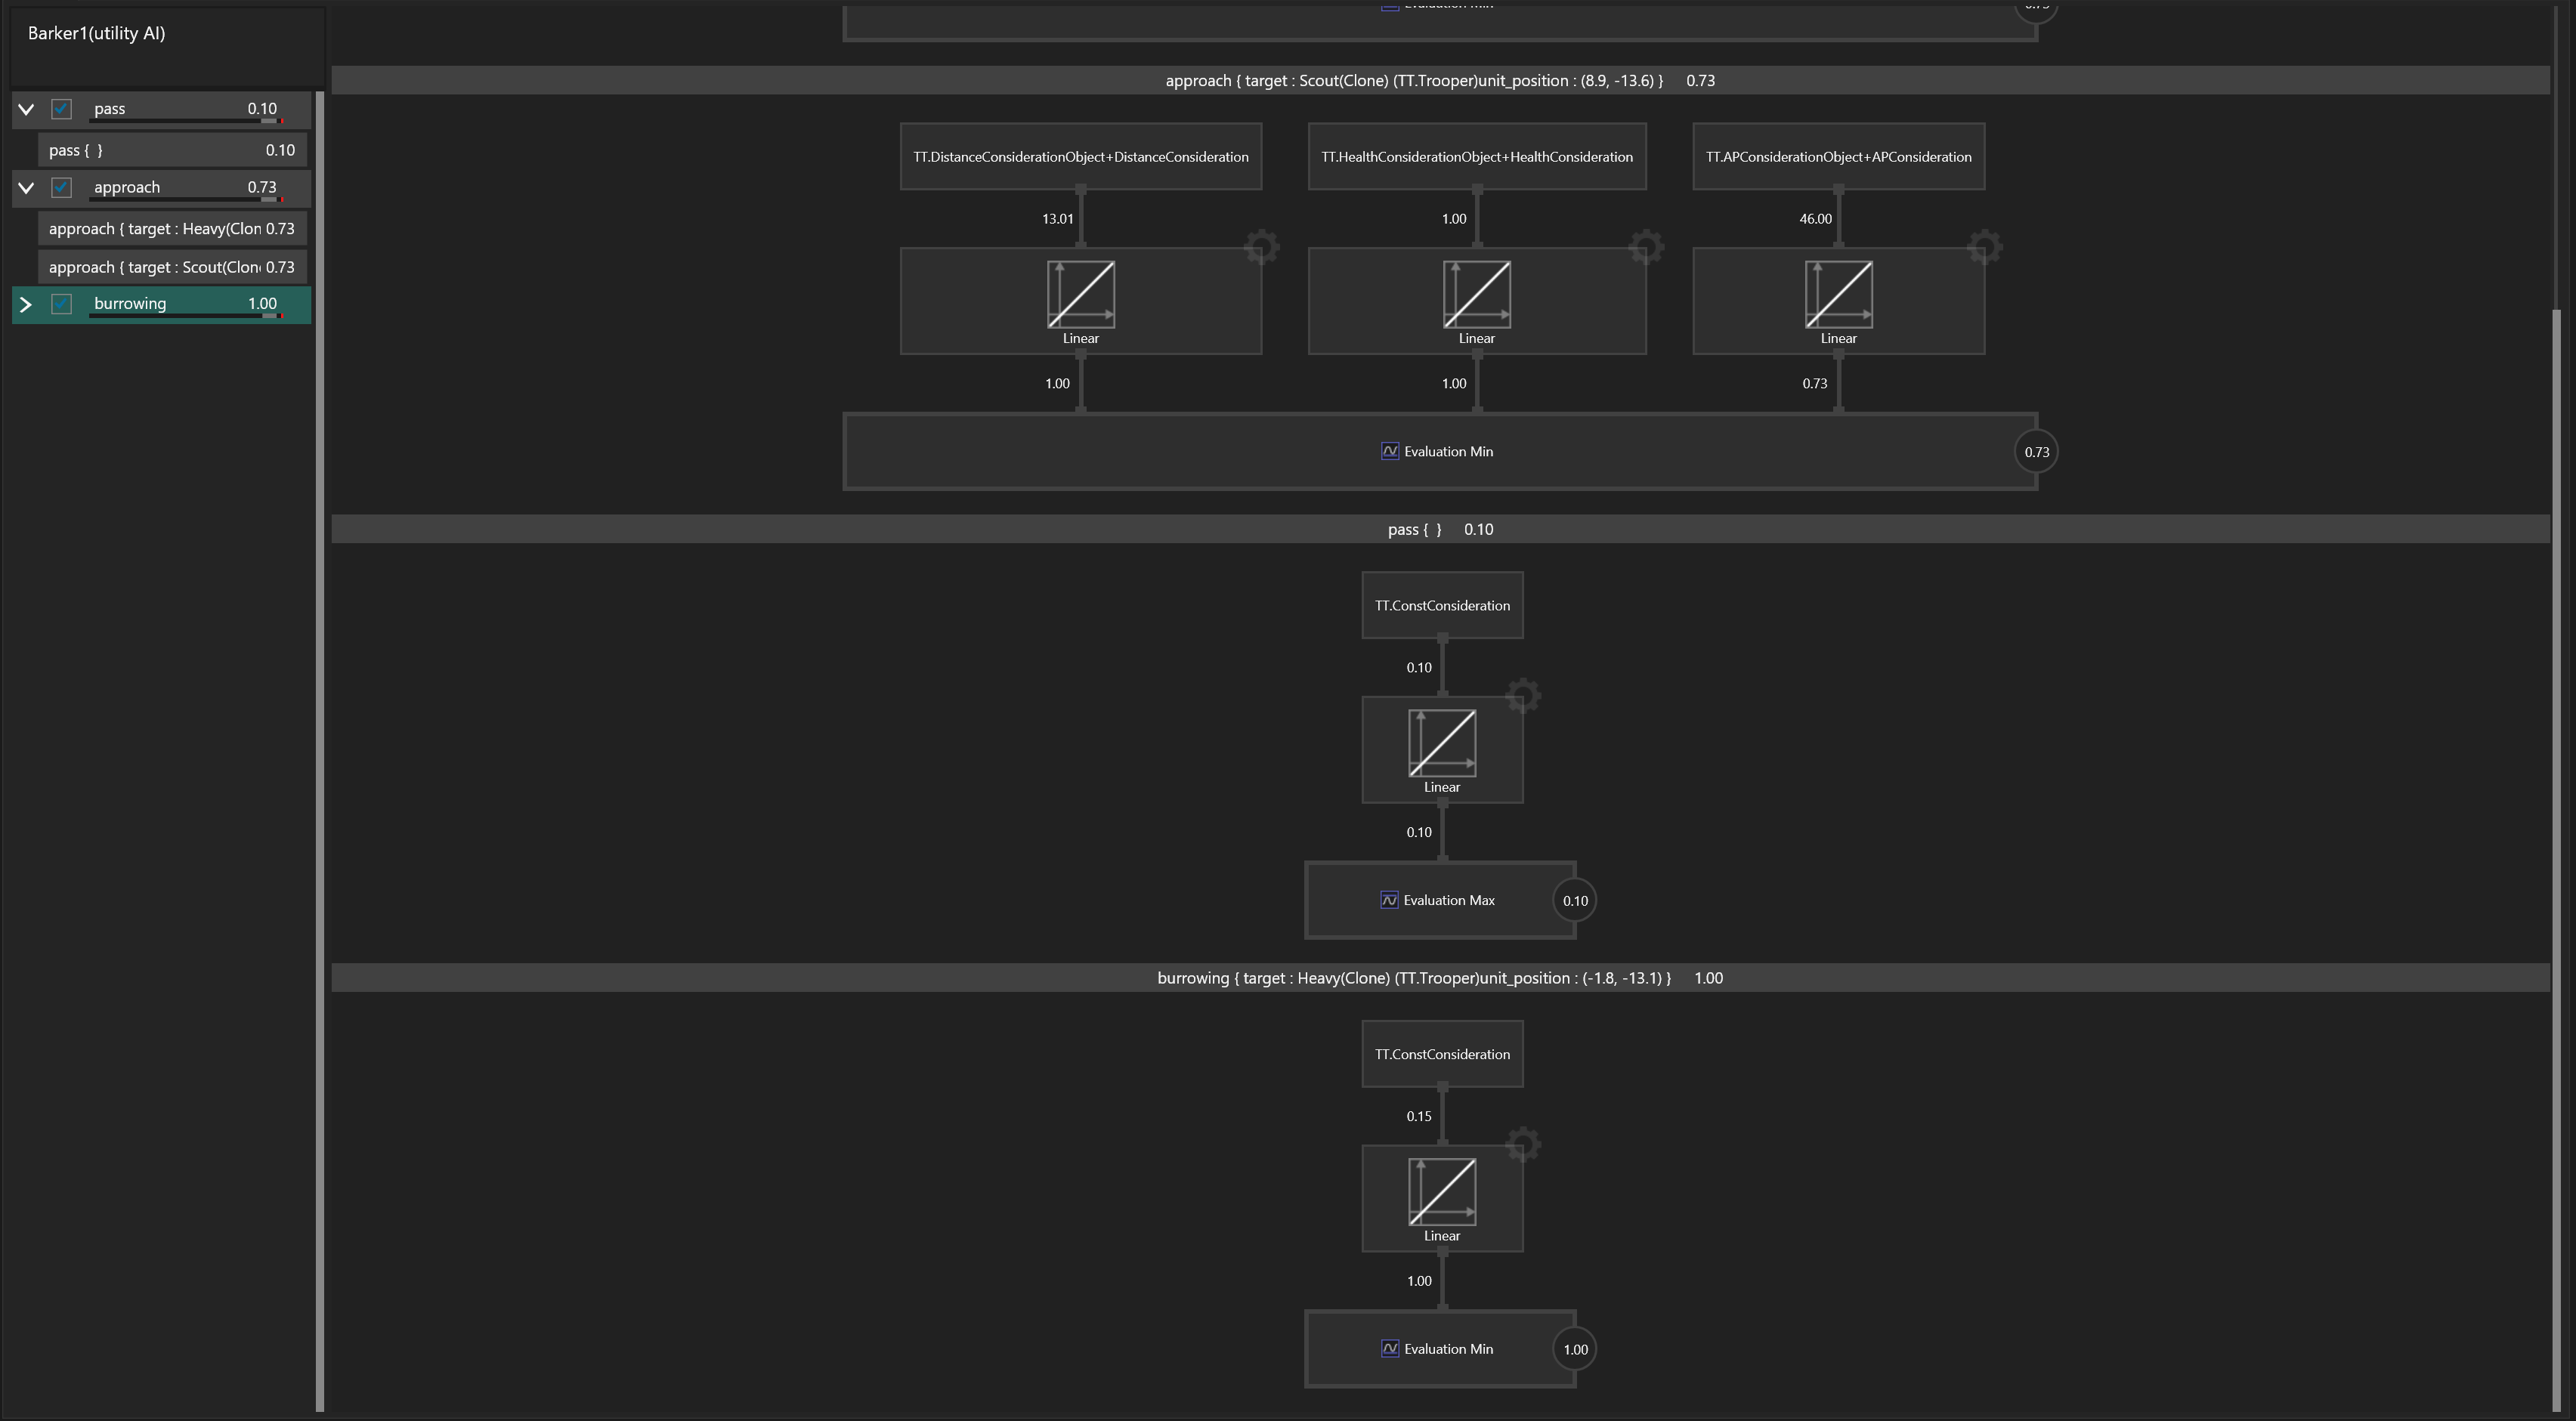
(3) - Entity list - on this list you can see all entities that use Utility as their reasoner and are present in the currently open debug file. This is a common tab for all debug views. Under each entity, you can see black bar with certain fragments highlighted. The bar reflects the timeline. The highlighted intervals show parts, where the entity was actively selecting behaviors.
(4) - Action space - this view lists prefabs of behaviors that are used in the Utility reasoner. Clicking the down arrow shows all instances of behaviors based on the particular prefab.
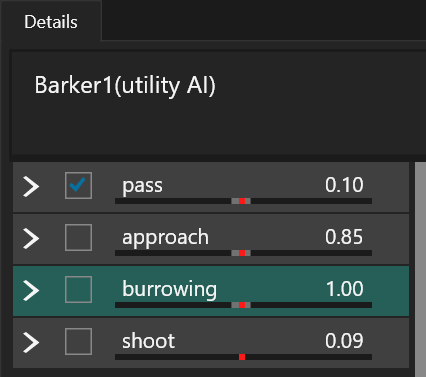
Please note that the "best" behavior, i.e., the one that was ultimately chosen, is highlighted for you convenience. In figure below, it is the burrowing behavior with score equal to 1.0.
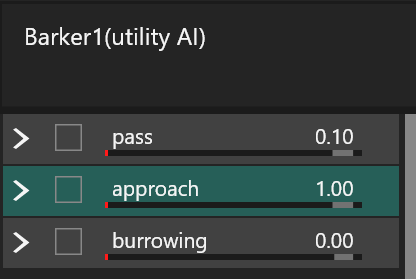
and here, a different vehavior won:
(5) - Action instances - distinct instantiations of behaviors of the same type. Each instance may have different parameters. Naturally, all of the instances based on the same prefab share the same evaluation mechanism.
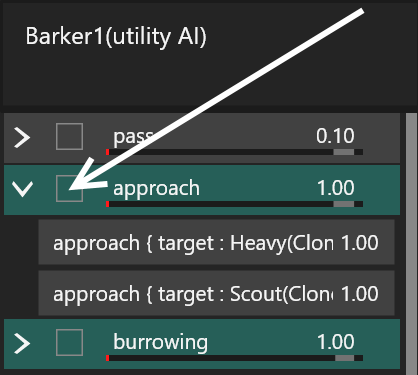
Note that, apart from names, you can see text representation of behaviors' parameters. If you want them to appear here, make sure they are serialized (Debugging Setup: Tutorial). In this example, the parameters were written to a blackboard returned by context producing function for the behavior prefab.
(6) - Detailed actions view - in this panel you can debug how selected action was evaluated at given timestamp. You can see the consideration, curves and evaluators it uses and the actual values passed as input and output to the respective elements.
The detailed panel shows elements that make up for the utility evaluation flow of a given behavior. The whole process starts with computing values of the considerations. These are inputs about the world. You can then debug how these values "flow" until the final utility score is computed:
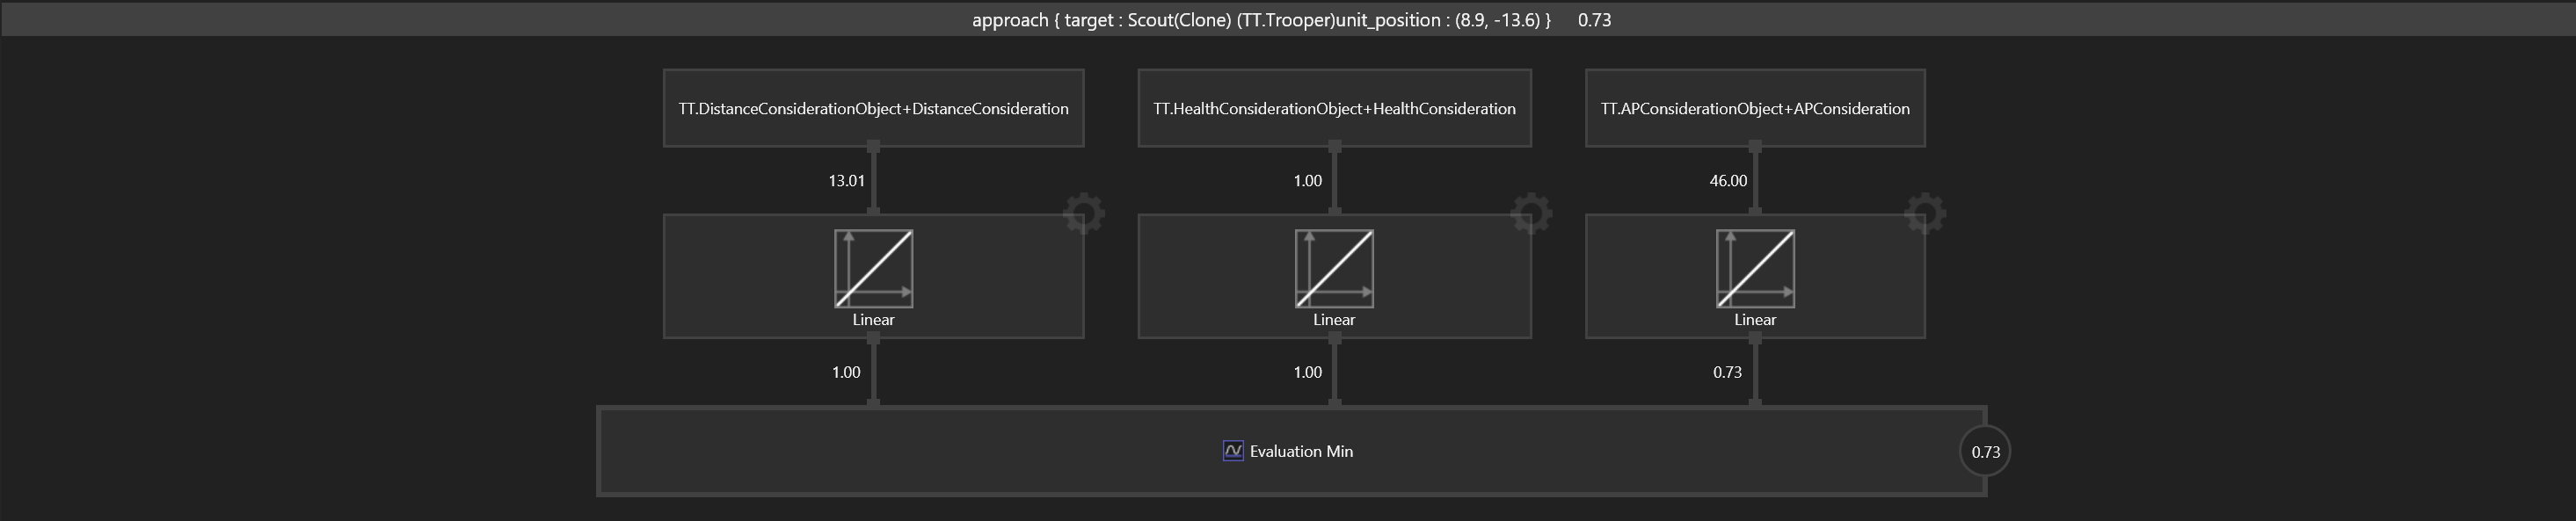
(7) - action and its current score.
(8) - consideration name and its current value.
(9) - curve type and its output value.
(10) - evaluator type and its output value.
If you select multiple behaviors, you can see their respective diagrams in a row layout:
| icons of curves are provisional and may change. However, they will depict the curve type as clearly as possible. |
Typical Usage
It is rather self-explanatory already, but just to sum up what you typically use this debugger for:
-
Investigate which behaviors are chosen at particular time
-
Locate situations you don’t like and you expected a different behavior
-
Look what values that are produced by considerations
-
is their logic implemented correctly?
-
maybe the existing considerations are too simple and not take something important into account
-
-
Check what happens with the values from considerations
-
a curve might be of wrong type
-
a curve might be parameterized incorrectly (see its parameters and bounds in the code)
-
-
Look at scores the behaviors are assigned to
-
if you expected different outcome then some of them will probably too high or too low
-
maybe you should change the evaluator type
-
maybe there are not enough distinct instances of a particular behavior
-
maybe the best option is to introduce more considerations
-
maybe one behavior is always assigned the highest score
-
maybe particular behaviors are changed too often? increase
persistence -
…
-